Two of the reference books for Lean practitioners are Learning To See and, somewhat less well known, Seeing the Whole Value Stream.
These books have been used by generations of practitioners to structure their Value Stream Mapping (VSM) processes, and remain highly recommended reading!
This literature has highlighted several important points:
- To improve a process, let alone a supply chain involving multiple players, you have to start by making the process visible. Some say that you only improve what you measure — but before you measure, you have to see
- Constructing a graphical visualization of a whole system, with your team, makes it easier to create a consensus, and thus paves the way for taking action on improvements
The practice of establishing VSMs — current state, future state, ideal state — has become widespread through Lean Six Sigma approaches, but my observation is that it remains limited and fragmented. Many SMEs have never implemented the approach, and in large corporations, it is often limited to a few perimeters.
When we start a Demand Driven project, we start by mapping the existing flows — representing them visually — and so our first question is: “Do you have a flow map of your entity / of your value chain?
The answer is an overwhelming no, and occasionally, “Oh yeah, remember, we had a consultant do that a few years ago. Where is that?”
There are undoubtedly structural reasons why this practice of visualizing flows remains limited:
- It is a collective effort that requires an investment of time, so it is not done routinely
- It requires a cross-functional approach, and most teams are focused on the perimeter of a department or function — so capturing the systemic/cross-functional dimension requires crossing boundaries
- There are no tools that facilitate routine use of this visualization
- Supply chains and processes are increasingly complex, with multiple exceptions that are difficult to map
- Things are changing faster and faster: new products, changes in manufacturing and transportation processes, changes in lead times, changes in demand — and these make the mappings we’ve developed quickly outdated
In fact, traditional flow mapping approaches involve, for example, rolling out brown paper on the wall, formalizing each process step with post-it notes, associating field measurements through a Gemba tour, etc. Not something you would do routinely.
What if we could generate these visualizations directly and continuously from our information systems? Are we in the digital age or not?
Enter Process Mining
In recent years, a technology called “process mining” has emerged.
Rather than trying to describe this approach, let’s ask our new and somewhat disturbing friend ChatGPT:
ChatGPT, what is process mining?
“Process mining is an information management technique that uses log data to create a graphical visualization of a company’s work process. The goal of process mining is to enable a company to understand and improve its work processes by identifying bottlenecks, friction points and optimization opportunities.
To perform process mining, one usually starts by collecting log data from the company’s IT systems, which contain information about the activities performed by employees during their work. This data is then processed and analyzed to create a visual representation of the company’s work process, in the form of a workflow diagram or process graph.
Process mining can be used in many areas, such as supply chain management, quality management, project management and production management. It can help companies improve process quality, reduce costs and increase efficiency by identifying optimization opportunities and implementing solutions to solve them.”
Thank you ChatGPT, I confirm, you are a bit worrying…
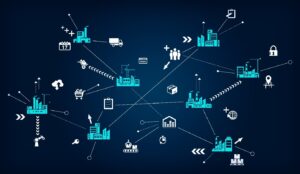
In other words, we get the transaction history of a given stream, we crunch it, and it goes something like this:
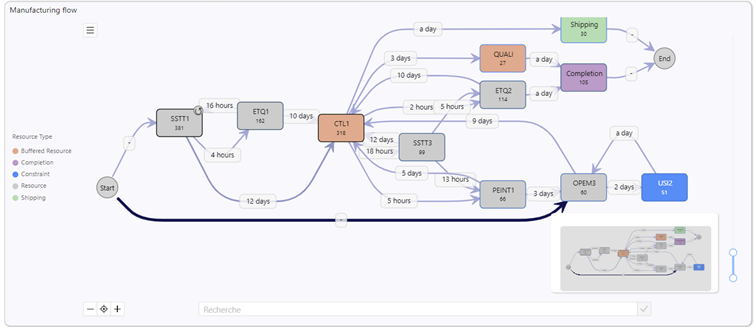
This example depicts a production flow in a factory.
You can directly visualize the main routings and inter-operational times, in relation to a historical period. It is also possible to identify which process was planned/standard and which one was actually carried out.
This visualization is available continuously, reflecting the reality of the transactions over time.
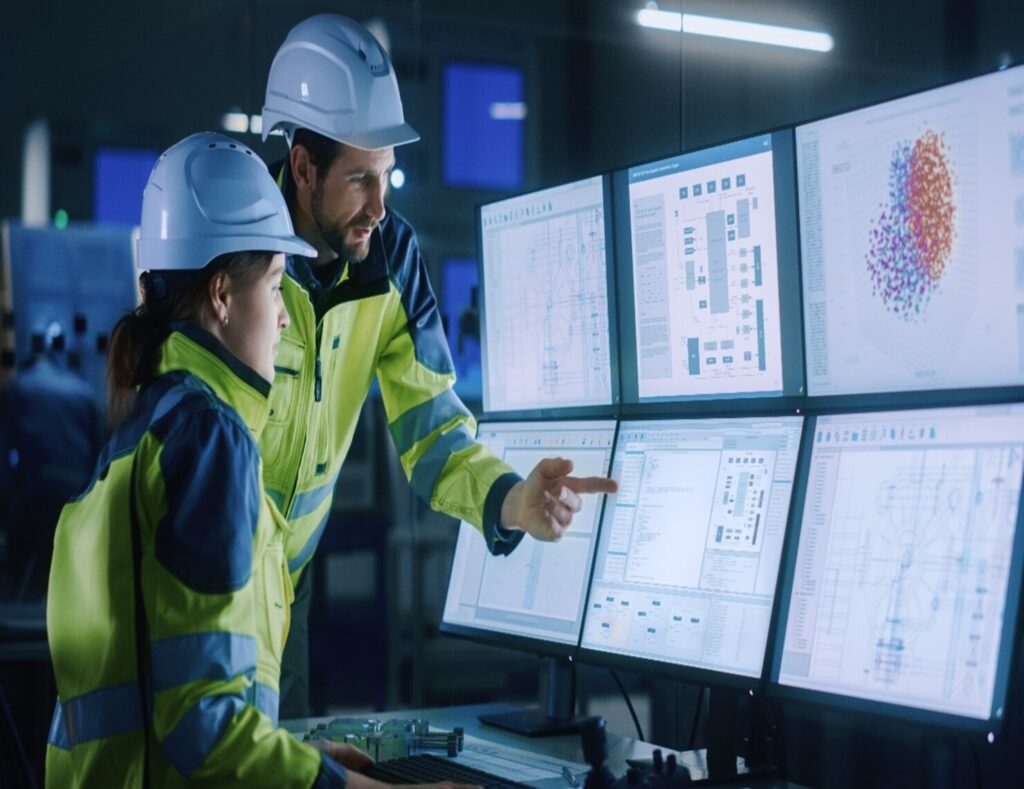
It supports the improvement process using this visualization during the workshop tour (on the Gemba) facilitates the dialog, eases common understanding, and factualizes the reality of flows.
This visualization process can take place on a shop floor, in an order-to-cash process, or in a global supply chain.
Making things visible, simple, understandable, identifying improvement levers, and feeding the continuous improvement process — all values that are in Intuiflow’s DNA — it was therefore natural for us to integrate the process mining technology into our functionalities. We are pleased to integrate this technology and make it available to all our customers in our Analytics module, in collaboration with the innovative German startup process.science.
![]() X
X ![]()
Want to know more? Get in touch!