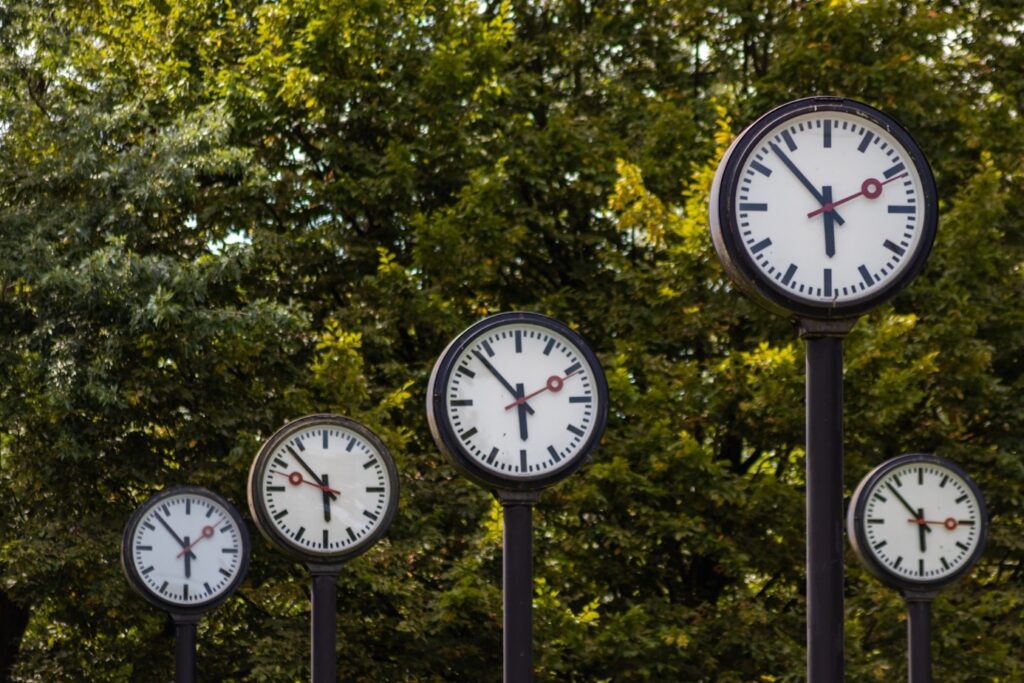
En sus órdenes de fabricación o pedidos a proveedores, tener fechas prometidas en el pasado significa saber cómo viajar en el tiempo: recibiremos esto la semana pasada – ¿recuerda el De Lorean?
¿Tiene que reprogramar continuamente sus próximas fases de fabricación para asegurarse de que sus órdenes de fabricación están correctamente alineadas?
Pongamos un ejemplo: tiene una lista de tareas con operaciones de 10 a 70.
Usted ha programado estas operaciones: cada una está programada a una hora determinada.

Todo va a ir bien… Excepto que no es así.
Dos días después, dados los problemas que se ha encontrado -esa maldita avería de la máquina, la inspección que hubo que añadir a raíz de la duda sobre la calidad-, está donde está:

Sólo ha completado las 3 primeras tareas, pero ha empleado dos tercios del tiempo, mientras que había previsto emplear sólo un tercio en esta fase.
¿Es necesario reprogramar las operaciones 40 a 70 en tiempo real?
Nuestra respuesta, en general, es no. Olvídelo. Reprogramar en tiempo real es una pérdida de tiempo. Está apuntando a un blanco en movimiento, y va a haber otros eventos.
«¿Qué quiere decir? Pero mi planificación original ya no es válida, ¡y puede que se me pase la fecha de finalización! ¡Terminaremos retrocediendo en el tiempo!».
Bien, empecemos de nuevo.
Cuando programó inicialmente sus operaciones, sabía que habría imprevistos. Nuestra recomendación -basada en los principios de la Teoría de las Limitaciones- es posicionar buffers de tiempo para proteger el flujo de estos riesgos habituales. Normalmente, en el flujo en cuestión, un buffer final, después de la operación 70, y quizás un buffer intermedio, antes de la operación 40:

La función de estos buffers es proteger las operaciones posteriores y, en última instancia, el envío al cliente.
Hemos terminado la operación 30, pero vamos retrasados. Hemos agotado la mayor parte de los buffers antes de la operación 40. Bueno, todo va bien. Me encanta cuando un plan sale bien…

La situación podría ser peor: ¡hemos consumido todo el buffer intermedio y parte del buffer final! Mantenemos la calma, pero damos prioridad a esta orden sobre las operaciones 40 a 70.

Ah, ¿y si se agota? Sí, si se consume, hay que recalcular la fecha prometida e informar al cliente.
Otra forma de ver esto, y de identificar órdenes en riesgo, es trazar las órdenes en curso a lo largo de dos ejes: el porcentaje de finalización y la parte que se ha consumido en los buffers posteriores a la operación en curso.
Las órdenes de fabricación en la zona roja -en las que se ha consumido una gran parte o incluso la totalidad de los buffers posteriores- deben reprogramarse y es hora de informar al cliente con una nueva fecha prometida. ¡Para los que están en la zona azul o en la diagonal verde, de momento todo va bien!

En resumen:
- ¡No siga intentando reprogramarlo todo!
- Configure salvaguardas específicas (buffers) y controle activamente su consumo.
- Replanifique por excepción, para evitar retroceder en el tiempo, y mantenga informados a sus clientes.


