menu icon
close

Should you Reschedule in Real Time?

By Bernard Milian
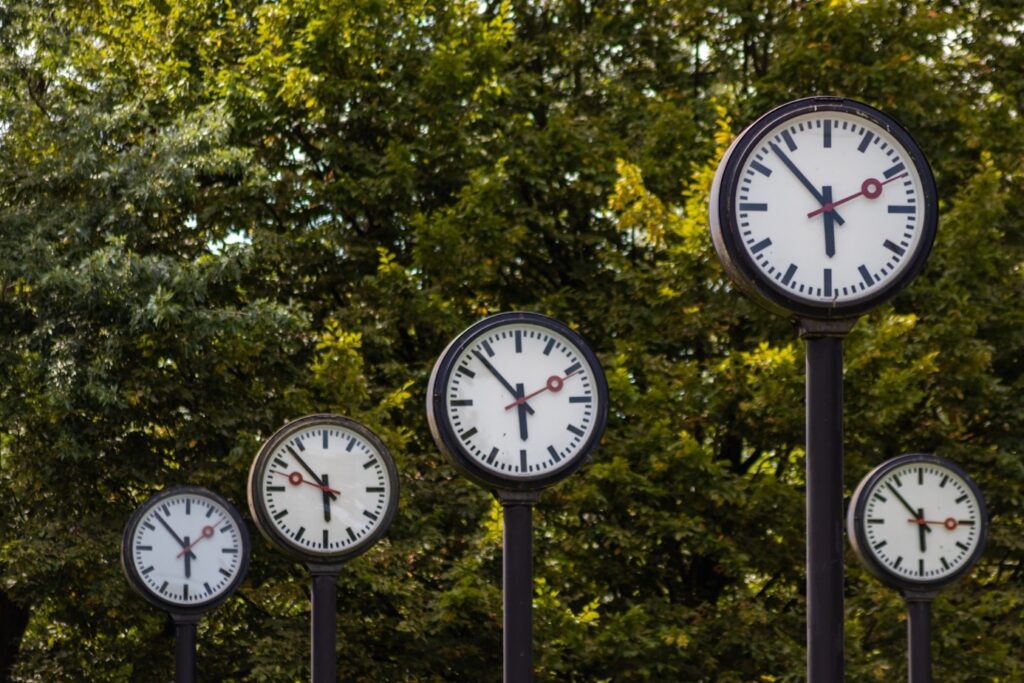
Five clock poles set at the same time in front of green, leafy trees.

For your production orders or supplier orders, having promised dates in the past means you know how to travel time: “We’ll receive this last week” – remember the De Lorean?

Do you have to constantly replan production steps to ensure your production orders are correctly aligned?

Let’s take an example: you have a task list with operations from 10 to 70.

You’ve scheduled these operations: each one is programmed at a certain time.

The image is a number line with the numbers 10, 20, 30, 40, 50, 60, and 70 marked on it. Each number is inside a blue rectangle placed above the number line, with the line itself marked in black and the numbers aligned horizontally in ascending order

Everything’s going to be fine… Except that it’s not.

Two days later, given the problems you’ve encountered – that damned machine breakdown, the quality inspection that had to be added as a result of the quality doubt, you’re where you are:

You’ve only completed the first 3 operations, but you’ve used up two-thirds of the time, whereas you had planned to use up only one-third at this stage.

Do you need to reschedule operations 40 to 70 in real-time?

Our answer, in general, is no. Let it go. Replanning in real-time is a waste of time. You’re aiming at a moving target, and there will be other events.

“What do you mean? But my original schedule is no longer valid, and I might miss the end date! We’ll end up going back in time!”

OK, let’s start again.

When you initially scheduled your operations, you knew there would be contingencies. Our recommendation – derived from the principles of the Theory of Constraints – is to position time buffers to protect the flow from these usual hazards. Typically on the flow concerned, an end buffer, after operation 70, and perhaps an intermediate buffer, before operation 40:

The image is a number line with the numbers 10, 20, 30, 40, 50, 60, and 70 marked on it. Each number is inside a blue rectangle placed above the number line, which is marked in black with the numbers aligned horizontally in ascending order. In the middle of the number line, between 30 and 40, there is a small rectangular strip divided into three colored sections: green, yellow, and red, from left to right. There is a similar small rectangular strip with the same color pattern placed after the number 70.

The function of these buffers is to position (time) safeguards to protect downstream operations – and ultimately the supply to the customer.

We’ve finished operation 30, but we’re behind schedule. We used up most of the buffer before operation 40. Well, all’s well. I love it when a plan goes off without a hitch…

The image is a number line with the numbers 10, 20, 30, 40, 50, 60, and 70 marked on it. The numbers 10, 20, and 30 are inside green rectangles, while the numbers 40, 50, 60, and 70 are inside blue rectangles. Each number is placed above the number line, which is marked in black with the numbers aligned horizontally in ascending order. Between 30 and 40, there is a small rectangular strip divided into four sections with the colors green, yellow, blue, and red from left to right. There is a similar small rectangular strip with the same color pattern placed after the number 70.

The situation could be worse: we’ve used up all the intermediate buffer and part of the end buffer! We keep calm but give priority to this order over operations 40 to 70.

The image is a number line with the numbers 10, 20, 30, 40, 50, 60, and 70 marked on it. The numbers 10, 20, and 30 are inside green rectangles, while the numbers 40, 50, 60, and 70 are inside blue rectangles. Each number is placed above the number line, which is marked in black with the numbers aligned horizontally in ascending order. Between 30 and 40, there is a small rectangular strip divided into four sections with the colors green, yellow, blue, and red from left to right. There is a similar small rectangular strip with the same color pattern placed after the number 70.

Ah, and what if it’s all used up?

Yes, if it’s dead, you have to recalculate the promised date and inform the customer!

Another way of looking at this, and identifying at-risk orders, is to plot orders in progress along two axes: their percentage of completion, and the portion that has been consumed on buffers downstream of the current operation.

Production orders in the red zone – a large proportion, if not all, of the downstream buffers have been consumed – need to be rescheduled, and it’s time to inform the customer of a new promised date! For those in the blue zone or on the green diagonal, so far, so good!

The image is a scatter plot titled "Fever Chart." The x-axis is labeled "Order Completion" and ranges from 0% to 100%. The y-axis is labeled "Buffer Consumption" and also ranges from 0% to 100%. The plot features a gradient background with different colored zones: red at the top, transitioning through green in the middle, and blue at the bottom. Blue dots are scattered across the plot, representing data points. There is a red rectangular highlight around the upper region of the chart, specifically covering the buffer consumption range from 80% to 100%.

In a nutshell:

–         Don’t keep trying to reschedule everything!

–         Set up targeted safeguards (buffers) and actively monitor their consumption.

–         Re-plan by exception, to avoid going back in time, and keep your customers informed.
Get in Touch

Share This Story, Choose Your Platform!

Facebook
Twitter
LinkedIn

Recent Posts

Sign up to our Newsletter

You may also enjoy

The hype dictatorship

In all fields, and the supply chain is no exception, propaganda has an enormous influence. We are subjected to it in our social life, in