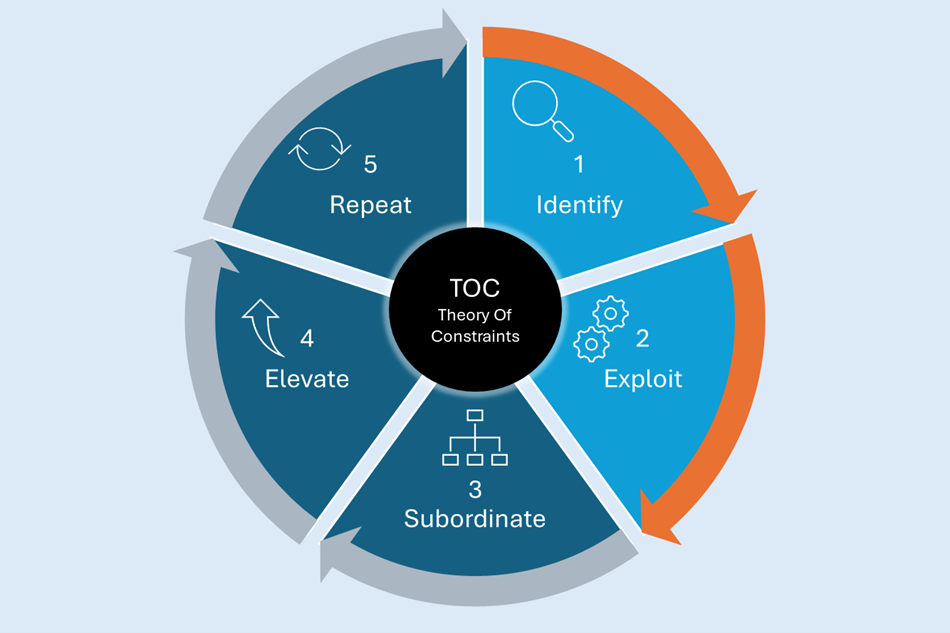
The “Five Focusing Steps” are a kind of counterpart to Deming’s PDCA – Plan Do Check Act. There are five steps for driving the improvement process. In this case, the idea is to consider a complete system – for example, the manufacturing flows in a factory – and to focus on the resource constraints to improve the system as a whole.
Having identified our constraints (see our previous article), we’re now going to make the most of them for productivity optimization.
Exploit
The term exploitation can have a negative connotation. Let’s not be shy: we’re in an industry that needs productivity optimization to compete. This means we want to exploit every minute of our constrained resources.
Every minute lost on the constraint is a loss for the entire system. So we want to optimize the use of the resource constraint and protect it from random events. OEE measurement is often contrary to flow improvement, but for constraints, it is absolutely relevant.
Here are a few examples of actions to carry out on the constraint:
- Clearly identify constrained workstations in the workshop so that everyone knows they cannot lose capacity on this workstation,
- Use SMED actions to optimize changes,
- Prioritize these positions for maintenance work,
- Ensure a pool of multi-skilled operators to avoid stoppages due to staffing.
Intuiflow helps to exploit constraints as follows:
Optimized Scheduling at Finite Capacity The optimized scheduling engine applies grouping rules to limit changeovers while respecting customer orders and inventory replenishment priorities. Available capacity is exploited to the fullest extent.
The resource load graph below shows the load from this finite capacity scheduling. Ouch, in this case, we’re about two days late on this constraint—Murphy’s Law has likely struck. It reflects real life in a factory, where management attention focuses on flow improvement and exploitation of constrained resources.

Time Buffer Management
A constraint must never run out of work. So, we establish a time buffer in front of this workstation, a queue of work-in-progress. This queue is visualized via a buffer board displayed near the constraint in the workshop. This setup provides visibility on the time buffer management status, helping participants avoid any risk of de-buffering and ensuring a shared understanding of priorities.

Analytics and Capacity Demonstration
To make the most of constraints, we analyze performance histories: Is the time buffer in front of the constraint effective? What is the demonstrated capacity? What are the root causes of issues?
Example below: The time buffer has been protected well for weeks, and there’s no delay in making the constraint available. In fact, there’s too much advance (blue), indicating we can reduce routing times or lead times for earlier operations.

We see that our primary problem drivers are staffing issues, emphasizing the need to improve multi-skilling!

Finally, we measure the capacity demonstrated by these constraints. Below is the evolution of the routing hours on a primary constraint at one of our industrial sites – it’s clear that “focusing” on this constraint yields improvements, increasing the overall capacity of the manufacturing flows (more on this in step 4-Elevate).

We’re ready to move on to “3-Subordinate”… in a future episode of this blog. Stay tuned.
Next:
- Subordinate
- Elevate
- Repeat
Read more about the Five Focusing Steps.


