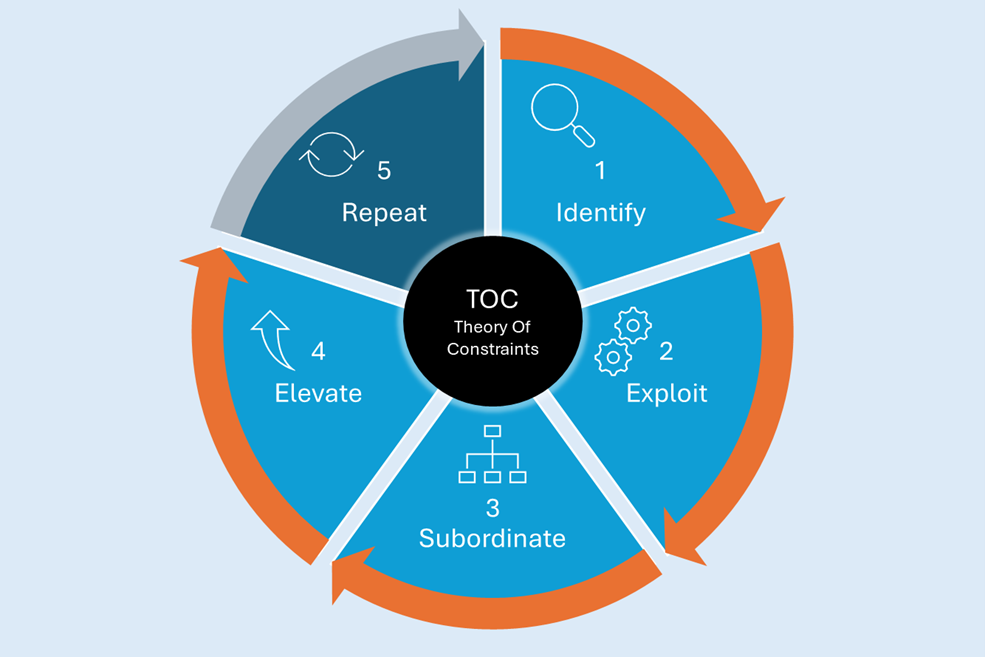
Are you familiar with the “five focusing steps”? This approach is at the heart of the Theory of Constraints (TOC), the school of thought initiated by Dr. Eli Goldratt, author of the bestseller “The Goal.”
Having identified our constraints, optimized their use, and subordinated other resources to these constraints, we are now equipped with a robust control model for operational control:
- Our work-in-progress is under control.
- Our promise dates are reliable, and so is our ability to meet them.
- Our lead times are reduced through targeted lead time reduction strategies.
- Constraints stop changing constantly, which reflects a stabilized and controlled model.
Elevating the Constraint
At this stage, and only at this stage, do we consider solutions for increasing the capacity of our constraint through effective capacity planning.
Increasing capacity is not a trivial matter; it’s an investment and comes at a cost. It often involves adding staff, adding shifts, new equipment, or subcontracting—all impactful for throughput improvement but none of which is free. Jumping into a capacity increase without first achieving operational control will likely lead to waste. Why increase capacity if you haven’t identified and controlled your constraints effectively?
Once your model is robust and predictable, increasing the capacity of your constraint(s) will increase the throughput of your entire system. Thanks to steps 2 and 3, you’ve likely already seen throughput improvement and capacity gains.
You will employ techniques like TPM, SMED, and 6 Sigma, but further elevation may require strategic investment.

S&OP to Elevate
In terms of S&OP to elevate, Sales and Operations Planning is the primary process to consider. For medium- to long-term projections (up to 3 years), Intuiflow’s S&OP module supports this strategy with the same stock buffer, time buffer, and constraint-based scheduling logic applied in day-to-day operational control. This module also allows you to model scenarios at various capacity levels, such as finite or infinite capacity planning.
Examples:
- What if we increase yield by 10% starting in June?
- What if we add weekend shifts?
- Add operators?
- Outsource 15% of volume starting in March at a specified cost?

These projections influence inventory management, service levels, lead time reduction, and work-in-progress, helping you make data-driven investment decisions with Intuiflow’s Power BI platform. This platform assesses scenario impact, allowing for well-aligned strategic choices with real-world operational impact.
Rather than aligning the planets between demand and supply, the role of S&OP is to implement an adaptive strategy that can truly elevate our operational capabilities.
We’re ready to move on to the “5-Repeat” stage…stay tuned.


