The old-fashioned S&OP is a laborious and sequential process.
The end of the month has just been closed. We know the sales, after aggregating inputs from all countries. We compare actual sales with forecasts, we generate statistical forecasts for the coming months, and we start the process of collaboration with the different marketing and sales organizations of the company, through a series of “demand reviews” in order to capture market information and elaborate a consensus forecast. We are already in the second week of the month.
We load these forecasts into the company’s ERP system(s). We run the MRP calculation and RCCP. We foresee supply difficulties for certain materials. The machining capacity will not be sufficient in May. By the way, for the launch of the new product line, we have to reserve 25% of the machining capacity for the pre-series in May — otherwise, the July launch would be postponed to October and we would lose sales, which we cannot afford. This promises to be a very challenging supply review in week three.
We have to find the least bad scenario to accommodate the situation, so we extract the data from the ERP and we crunch the data in Excel, or maybe Power BI. We put it all together in a Powerpoint and we’re ready, the night before, for the “pre-S&OP meeting” (ceremony, sometimes) scheduled for the fourth week of the month. There are 12 people in the room, you are the S&OP champion, and you are on the grill presenting the results of the analyses.
Many in the room are discovering the numbers… and questioning them. We’ll never make these sales this month, it’s not possible, it’s already the fourth week of the month, we can see that it’s not realistic. As for the production, let’s not talk about it, with the quality crisis that we have just suffered.
Well, OK, but the S&OP management meeting with the CEO is next week, the first week of the new month. What arbitrations are required? We need to make decisions. We’ve been putting it off for two months to decide to go 5×8!
A caricature? Unfortunately, not in most manufacturing companies.
The Need for Continuous Adaptation
If your S&OP cycle is monthly and takes about four weeks, you are always chasing an outdated view.
If the energy in your S&OP process is 65% data collection, 15% formatting, 10% internal politics and 10% stepping back to make decisions, you are wasting 80-90% of your team’s time.
If your S&OP incorporates only one scenario — the consensus forecast, and the master production schedule to which you are committed — you are deluding yourself, because reality will not have the good taste to respect this plan.
If your S&OP does not correspond to what will actually be achieved in the field, you have performed a theoretical exercise, but you will not be able to execute your strategy.
The reality of the environment in which companies evolve today requires continuous adaptation, along with a managerial process and tools that facilitate it by effectively connecting day-to-day management and mid- to long-term management decisions.
Prerequisites for Adaptive S&OP
Orchestrating this adaptation requires several components: Defining an operating model that’s driven by real demand, having shared visibility, having the right IT tools, and ensuring that the teams are involved in steering — from the field to the management team — have a common language and understanding.
The implementation of a complete operating model — inventory buffers, time buffers, capacity buffers, constraints and control points — effectively creates a digital twin of the company’s supply chain. This digital model can now be used routinely to project demand and supply scenarios into the future.
As this model is used both for projections and for managing the daily priorities related to the generation of manufacturing, purchase, or transfer orders, it ensures that the scenarios envisaged are compatible with the reality on the ground. Relevant simplifications are applied so that this model is not a gas factory but an actionable representation of reality. For example, only real capacity constraints are planned at finite capacity.
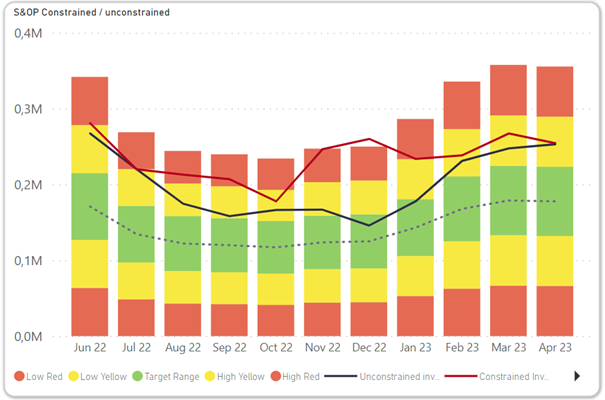
Visibility is obtained through the digital platform that aggregates data from transactional systems, supports simulations and allows intuitive visualization to facilitate decision-making. As an example, the graph below shows a scenario for a product family whose production capacity would be saturated at the beginning of 2023. The finite capacity scenario proposes to pull ahead some workload (red projected stock curve). The investment in stock, the impact on lead times and the difference with respect to the scenario where capacity is increased are shown in direct readout. This view is constantly updated according to demand scenarios and upstream constraints and allows for informed decision-making. The trade-off is easy: having 60% more inventory at the end of the year versus having 10% more capacity in the first quarter of 2023.
Finally, to ensure a common language and understanding among teams, there is of course initial training to be provided (Demand Driven Institute courses are valuable for this). But also — and perhaps most importantly — all visualizations and management processes, KPIs, performance measurements, and progress measurements – must be derived from the Demand Driven operating model in the company’s daily, weekly, monthly and quarterly management rituals. Few companies have reached this level of maturity today, but those that do are much more successful at adapting, on an ongoing basis, thanks to more relevant and timely decisions!
There are many DDMRP software packages available today, but few solutions on the market allow for this real demand management integrating a complete model, as Intuiflow does (compliance with DDMRP, DDOM and DDS&OP certifications from the DDI). Want to know more? Let’s get in touch!