Competition is more intense than ever. Companies closely monitor consumers and track the actions of their rivals. New products are rapidly copied and replicated. Companies must maintain a compelling and thoughtfully priced product range, but they will have difficulty standing out in the market without excellent service levels.
In fact, research suggests that 80% of customers consider the experience of interacting with a supplier as important as the goods they offer, and 66% of consumers expect companies to understand their needs.
Maintaining high service levels enhances customer loyalty and multiplies sales. Low service levels, by contrast, increase the risk of missing profit, losing to competitors, and increasing customer dissatisfaction.
Service levels also play an important part in building supply chain and inventory management strategies. To effectively evaluate the amount and structure of your inventory, you must take service level into consideration. Otherwise, this estimation will be one-sided and incomplete.
Therefore, almost all inventory management automation projects aim to improve service levels and help the company fulfill its obligations to customers.
But how do you calculate and track service levels? There are some industry specifics. For example, in retail, the out-of-stock level is calculated (lost sales due to the lack of goods), along with its reverse indicator — the level of availability on the shelf.
In production and distribution, we evaluate the fulfillment of customer orders. However, if we don’t correctly calculate these indicators, our ability to assess company activities will be unreliable and non-objective.
Top 4 Mistakes When Measuring Service Levels
Here are four common mistakes that companies make when measuring their service levels:
1. You don’t fix the initial client’s order (i.e., true demand)
Some ERPs automatically adjust the quantity of an order to the available on-hand balance in the warehouse. For example, if an order comes in for 100 units, but there are only 80 units in stock, the quantity is fixed as 80 in the ERP.
After these 80 units are shipped, the company compares the amount that was ordered (80) and the amount that was shipped (80) and concludes that the service level was 100%. However, the unfixed quantity (20) is still part of the original demand and must be part of this assessment.
In these situations, client satisfaction is often extremely far from 100%, leaving a big gap between the indicator and the real situation.
2. You measure the shipped quantity of goods on an aggregate basis, not by position
Suppose a company receives an order for 100 units, including 50 units of product A and 50 units of product B.
The total shipment for this order will be 100 units. However, product A is delivered in the amount of 30 units, product B in 40 units, and the difference (30 units) is covered by item C, which is similar but not exactly equivalent.
Formally, the service level for this order is satisfactory. Is the client satisfied with the fulfillment of his order? Probably not. In the long term, the supplier will get a reputation for being an unreliable and unpredictable partner.
3. You measure order fulfillment by quantity, not time
Imagine your client receives 100 units — the exact quantity that was ordered.
But what if the order was fulfilled a month after its due date, since the required quantity wasn’t in stock and had to be purchased or manufactured specially?
Failing to comply with promised lead times takes a substantial toll on consumer loyalty, so it must also be incorporated into the service level calculation.
4. You set different service levels for different types of goods
If we assume that a 75% service level is acceptable for category C, it will artificially exaggerate the service indicator. In fact, this is an attempt to hide poor-quality planning. As a result, a high service level is maintained mainly for goods of group A, which include items that generate major sales, but with low margin. At the same time, goods with high margins and significant variability in demand (category C) get insufficient attention. This approach is related to the widespread notion that the inventory level depends on the service level, and the increase in availability leads to growth in safety stocks. But if you go beyond the usual patterns, then it becomes clear that the most useful information can be obtained by analyzing deviations, and not by tracking what is going according to plan.
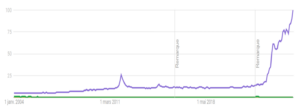
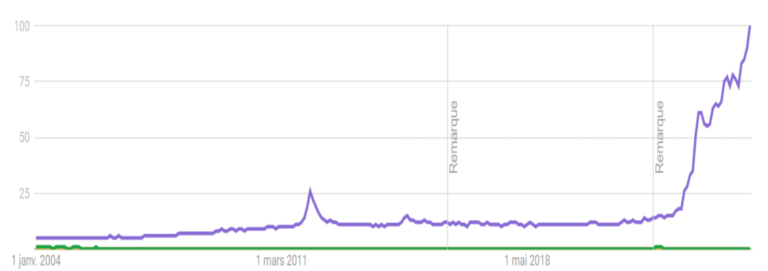
In our experience, there is an indicator that helps to avoid the above distortions in the estimation of service level and quality of order fulfillment. We recommend using the OTIF (on-time and in-full) indicator, calculated as the ratio of the number of positions fulfilled in full and on time to the total number of all positions in customer order. According to McKinsey research, 96% of the surveyed companies use the OTIF, while:
- 79% of companies track OTIF comprehensively (both on-time and in-full)
- 17% of companies calculate OTIF separately (on-time and in-full separately)
Calculating this indicator, it is possible to determine whether all supply parameters (number of SKU, ordered quantity and delivery time) have been provided in the supply chain. What makes OTIF different is that it assesses the supply from the customer’s point of view. It answers the question: How often do the clients get what they want at the time they want it? Retail chains often publish monthly or quarterly OTIF information as standards to encourage on-time delivery by suppliers. Usually, OTIF is calculated as a percentage, and for its correct measurement, the following requirements should be met:
- Consider the expected delivery date (in some cases even time) specified in the sales order
- Fix the date and time of the actual delivery
- Keep a record of the reasons why an order fulfillment doesn’t meet the OTIF conditions
If the customer has several orders at the same time, consider each delivery separately. There are four possible scenarios:
- In full and on time
- In full, but not on time
- On time, but not in full
- Not in full and not on time
The OTIF meets two conditions at the same time — on time and in full delivery. This indicator acts as an integral KPI for understanding the overall effectiveness of your company’s logistics. When analyzing the cause of identified deviations and structural problems, you should pay attention to the influence of temporary factors such as seasonality, marketing campaigns and promos, etc.
In practice, consider OTIF together with other supply chain performance indicators. Leading companies constantly compare their customer lead times with average LT in their industry or LT of major competitors. Top management considers monitoring and analyzing the OTIF as one of the ways to increase sales (due to better product availability for customers) and cut operating costs (due to achieving higher reliability of the supply chain, reducing the time for fulfilling orders, and maintaining stocks at an optimal level). It should be noted that the business processes effectiveness is assessed only after the fact with the help of OTIF. It’s a statement of accomplished fact. Correct measurement and analysis of OTIF should be combined with preventive actions that will increase the product availability level in the warehouse:
- Timely replenishment and order execution control
- Quick response to deviations
- Resolving events that may affect the availability of goods (promotions, tender orders, seasonality) in the inventory management system
- Comprehensive inventory management automation
In post-pandemic realities, ensuring a high level of product availability for customers while optimizing inventory and logistics remains a major challenge. Monitoring and analyzing all stages of procurement and delivery, including using the OTIF, will significantly increase the effectiveness of inventory management and relations with clients.
You Can’t Manage What You Don’t Measure
Enhancing service level is always a long-lasting process that requires organizational efforts and financial costs. But research shows that 84% of companies that have focused on service level improvement report an increase in annual revenue. This is explained by the high level of customer retention and loyalty, a significant volume of repeated purchases, and an increase in the active customer base. Therefore, the emphasis on service meets market trends and is a necessary condition for the development of modern manufacturers and distributors.