Before MRP, the most popular approach to inventory management was Order Point, where each point is independent. Yet the more complex an operational environment becomes — thanks to a broader SKU list or changes to assortment and demand — the more likely you are to see bimodal inventory distribution, when too little of the right and too much of the wrong inventories are at hand, and too much overall stock to compensate for the inadaptability of the approach.
Perhaps it’s not surprising that MRP, which opened a door to dependent planning, soon became the most widespread inventory management approach.
The logic behind MRP is really straightforward. First, you build a sales forecast, which planners typically get from the S&OP process. Once you “know” (i.e., can forecast) how much and when you are going to sell, and you understand the rate of error associated with the forecast, it’s not hard to calculate how much inventory should be in stock to cover projected sales for each SKU. Most companies have current inventory records and WIP (Work in Progress). Assuming how much and when it’s needed, compared to how much is available, the difference between them will be a requirement for production.
But in real life it is a bit more complicated. There’s more than one SKU, and there are some equipment requirements that make planners schedule work in certain sequences not only to cover demand, but to be “operationally efficient” (which usually means minimizing costs by enlarging production batches). Now, when the work is scheduled in exact quantities and timing, it’s easy to calculate material requirements through the BOM (Bill of Material). That’s why it is called dependent planning. Dependent planning is a system that generates supply orders for components only when and how much is needed to cover the production schedule.

Let’s review the APICS definition of MRP:
“A set of techniques that uses bill of material data, inventory data, and the master production schedule to calculate requirements for materials. It makes recommendations to release replenishment orders for material. Further, because it is time-phased, it makes recommendations to reschedule open orders when due dates and need dates are not in phase. Time-phased MRP begins with the items listed on the MPS and determines (1) the quantity of all components and materials required to fabricate those items and (2) the date that the components and materials are required. Time-phased MRP is accomplished by exploding the bill of material, adjusting for inventory quantities on hand or on order, and offsetting the net requirements by the appropriate lead times.” – APICS Dictionary
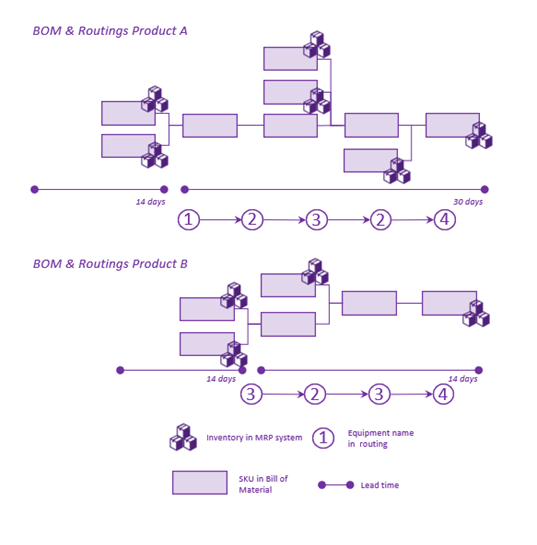
In the diagrams below, you can see a simple visualization of the Bill of Material structure — along with what equipment is being used to convert materials into finished products and in what sequence and timing. The icon with three boxes means stored materials or finished goods, depending on the level of BOM. Each rectangle represents a SKU in the BOM, while a circle with a number represents a specific piece of production equipment. As you see, we need 30 days to convert materials to finished product A and 14 days to make product B.
Because supply and production lead times are longer than customer tolerance times, the company needs to plan over this period. S&OP and forecast recalculation are time and energy intensive. Also, after every MRP run, the company gets a new result that contradicts the previous one, which confuses everyone, especially people on the shop floor who were supposed to physically execute it. So, in an attempt to stabilize the system, the production schedule is usually done monthly, one or two months in advance.
Monthly planning enables companies to simplify their management systems, making the plan a key managerial tool. It’s easy to understand if the sales department sold more or less than planned, or the operational department built according to plan or not.
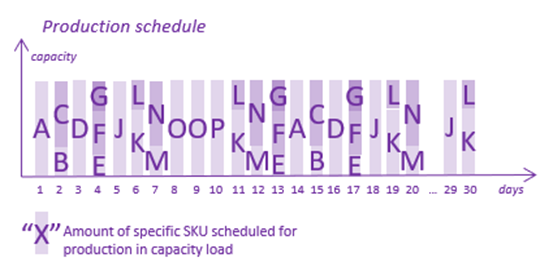
In the picture below, you can see a simple visualization of a sample MPS (Master Production Schedule). Each day, a specific SKU’s number and volume are scheduled in sequence for production. Again, using their lead times and BOM to calculate the requirements for products A an B, you can calculate their material requirements.
MPS and MRP are great solutions if you have 100% reliable suppliers, equipment, and materials — and 100% accurate master data and forecasts. Let’s discuss what happens when that is not the case.
Why Production Schedules Foster a False Sense of Stability
Picture yourself a planner at the plant. New month is coming, and the management team will be visiting. The S&OP process approved both sales and production plans. By your experience, you know that often the sales department asks to change the plan. So, you ask them again, “Is this the way you want me to produce, or should I make changes? Do you realize that all activities, including material purchasing will be aligned to this schedule?”
You will always get the same, honest answer at the beginning of the month: “This is the best plan we should follow.”
Your production schedule does not only cover forecasted sales, but is designed in a way that maximizes the effectiveness of your equipment and minimizes production costs like material waste and idle time. It is the best possible plan; no one can doubt that in the company. Management now assigns a KPI that will motivate you to execute the perfect plan, for example, percentage of plan execution. So, all you have to do to get a bonus — and to make the company successful — is to stick to the plan.
Now we reach the morning of Day 7. We are planning to finish product N and launch product M. It’s been seven days since we started schedule execution and we are preparing for two consecutive days of building product O. Suddenly we receive a request from a sales department to build products L and K because we just obtained a very profitable order from a client, and current inventories are not sufficient to cover it. Meanwhile, sales of product O were exactly as expected, and we still have safety stock. Let’s discuss our options on Day 8:
- Option A: Build O. We lose sales order, additional profits, and probably a client. But our KPI says we did great, since we executed the schedule. We get our bonus at the end of the month.
- Option B: Build K and L. We need additional work to prepare materials, we get more setups and, obviously, a higher percentage of idle time and a waste of material. Also, lower percentage of scheduled execution. Planners do not get a bonus. Instead, the Sales Department over-performs its plan and gets a bonus.
- Option C: Planner selects option “B” but cannot successfully execute it. MRP treats everything as dependent. The system is not designed to build what was not scheduled; there might also be a lack of materials or capacity. Which puts our planner back to option “A.”
This situation creates a foundation for conflicts between functions inside of a company. Planners want to pace with the schedule, but they literally can’t or don’t want to build what sales is asking them. The actual reason (option A or C) isn’t easy to see in most of the companies, which again, reinforces the internal conflict. Sales thinks that planners care only about their OOE and schedule execution, but are not able to see behind their function.
Which leads to two obvious potential solutions: To run MRP more frequently to adjust to market changes; or make a better forecast to minimize a need for rescheduling.
If more frequent runs create more mess on the shop floor, and material planning generates conflicting recommendations after each run, better forecasting often becomes the number one manager’s focus in search of solutions. Supply chains become more complex thanks to global sourcing and demand, longer lead times, and product complexity, while variety increases with simultaneously shortened product life cycles — all of which reduces forecast accuracy. Not because we forget how to calculate forecasts, but with the race of uncertainty, variability, and complexity of the environment we operate in, there is simply no answer in past data for the question of how the future will look.
How Safety Stock Amplifies Variability
APICS describes the Bullwhip effect as, “An extreme change in the supply position upstream in a supply chain generated by a small change in demand downstream in the supply chain. Inventory can quickly move from being back ordered to being excess. This is caused by the serial nature of communicating orders up the chain with the inherent transportation delays of moving product down the chain.”
What is not stated in this definition is the bi-directional nature of the effect. Because of this missing element, the most common attempts to mitigate the effect are efforts to increase forecast accuracy and the use of safety stocks. Safety stock is usually meant to cover the difference between what was expected and what was actually sold. But when the inventory level lowers even one unit below safety stock, it triggers re-supply, which, with the use of MOQs, even further amplifies variability and distortion in the bullwhip effect. It leads companies to a situation where they needs excess to inventory to cover these fluctuations, or less capacity to build extra stock when needed. Both options are bad for business.
How Demand Driven Methods Outperform MRP Inventory Management
Today’s companies need to be able to continuously adapt production to demand without sacrificing operational efficiency. This is the equation that Demand Driven methods can solve, using a set of techniques that integrate supply chain design and long, medium, and short-term management to reconcile business functions and focus them on what matters: serving customers profitably.
To learn more about how Demand Driven methods are different, stay tuned for our next post about DDMRP vs MRP!